Dope-Plot is a Python-based visualization tool for generating quadrant-style plots of tick.com.au’s four-bird personality styles (Eagle, Dove, Owl, and Peacock). It takes as input a data file (e.g., CSV) of individual or group personality scores and produces informative charts that help users quickly see:
- Individual personality radar plots
- Team or group distributions in a quadrant layout
- Pairwise comparisons (overlap of two individuals’ personalities)
…either from the command line or straight from an AI assistant via the bundled MCP server.
These plots are especially useful for workshops, coaching sessions, and team-building exercises, as they visualize how individuals align or differ on the four “bird” dimensions.
Each person scores on four traits, and the scatter plot places them on a quadrant defined by two axes: assertive ↔ reserved (horizontal) and people-oriented ↔ task-oriented (vertical).
| Bird | Quadrant | Style | Tends to be |
|---|---|---|---|
| Dove | top-right | Supportive & Caring | warm, people-oriented, reserved |
| Peacock | top-left | Talkative & Dramatic | warm, people-oriented, assertive |
| Eagle | bottom-left | Controlling & Forceful | task-oriented, assertive |
| Owl | bottom-right | Analytical & Logical | task-oriented, reserved |
Most people lead with one bird (their primary) and lean on a second (secondary); the charts show that blend rather than forcing a single label.
The Tick personality profiling system has been appreciated by many in the fields of sales training, leadership coaching, and personal development for its simplicity and ease of communication. Dope-Plot leverages this established framework to provide clear, accessible visualizations that help users understand and compare personality traits quickly. While the tool provides valuable insights and serves as a catalyst for discussion and reflection, users are encouraged to complement these insights with additional information and professional judgment.
- Features
- Installation
- Usage
- Input Data Format
- Use from AI assistants (MCP)
- Testing
- Example Outputs
- Design Notes
-
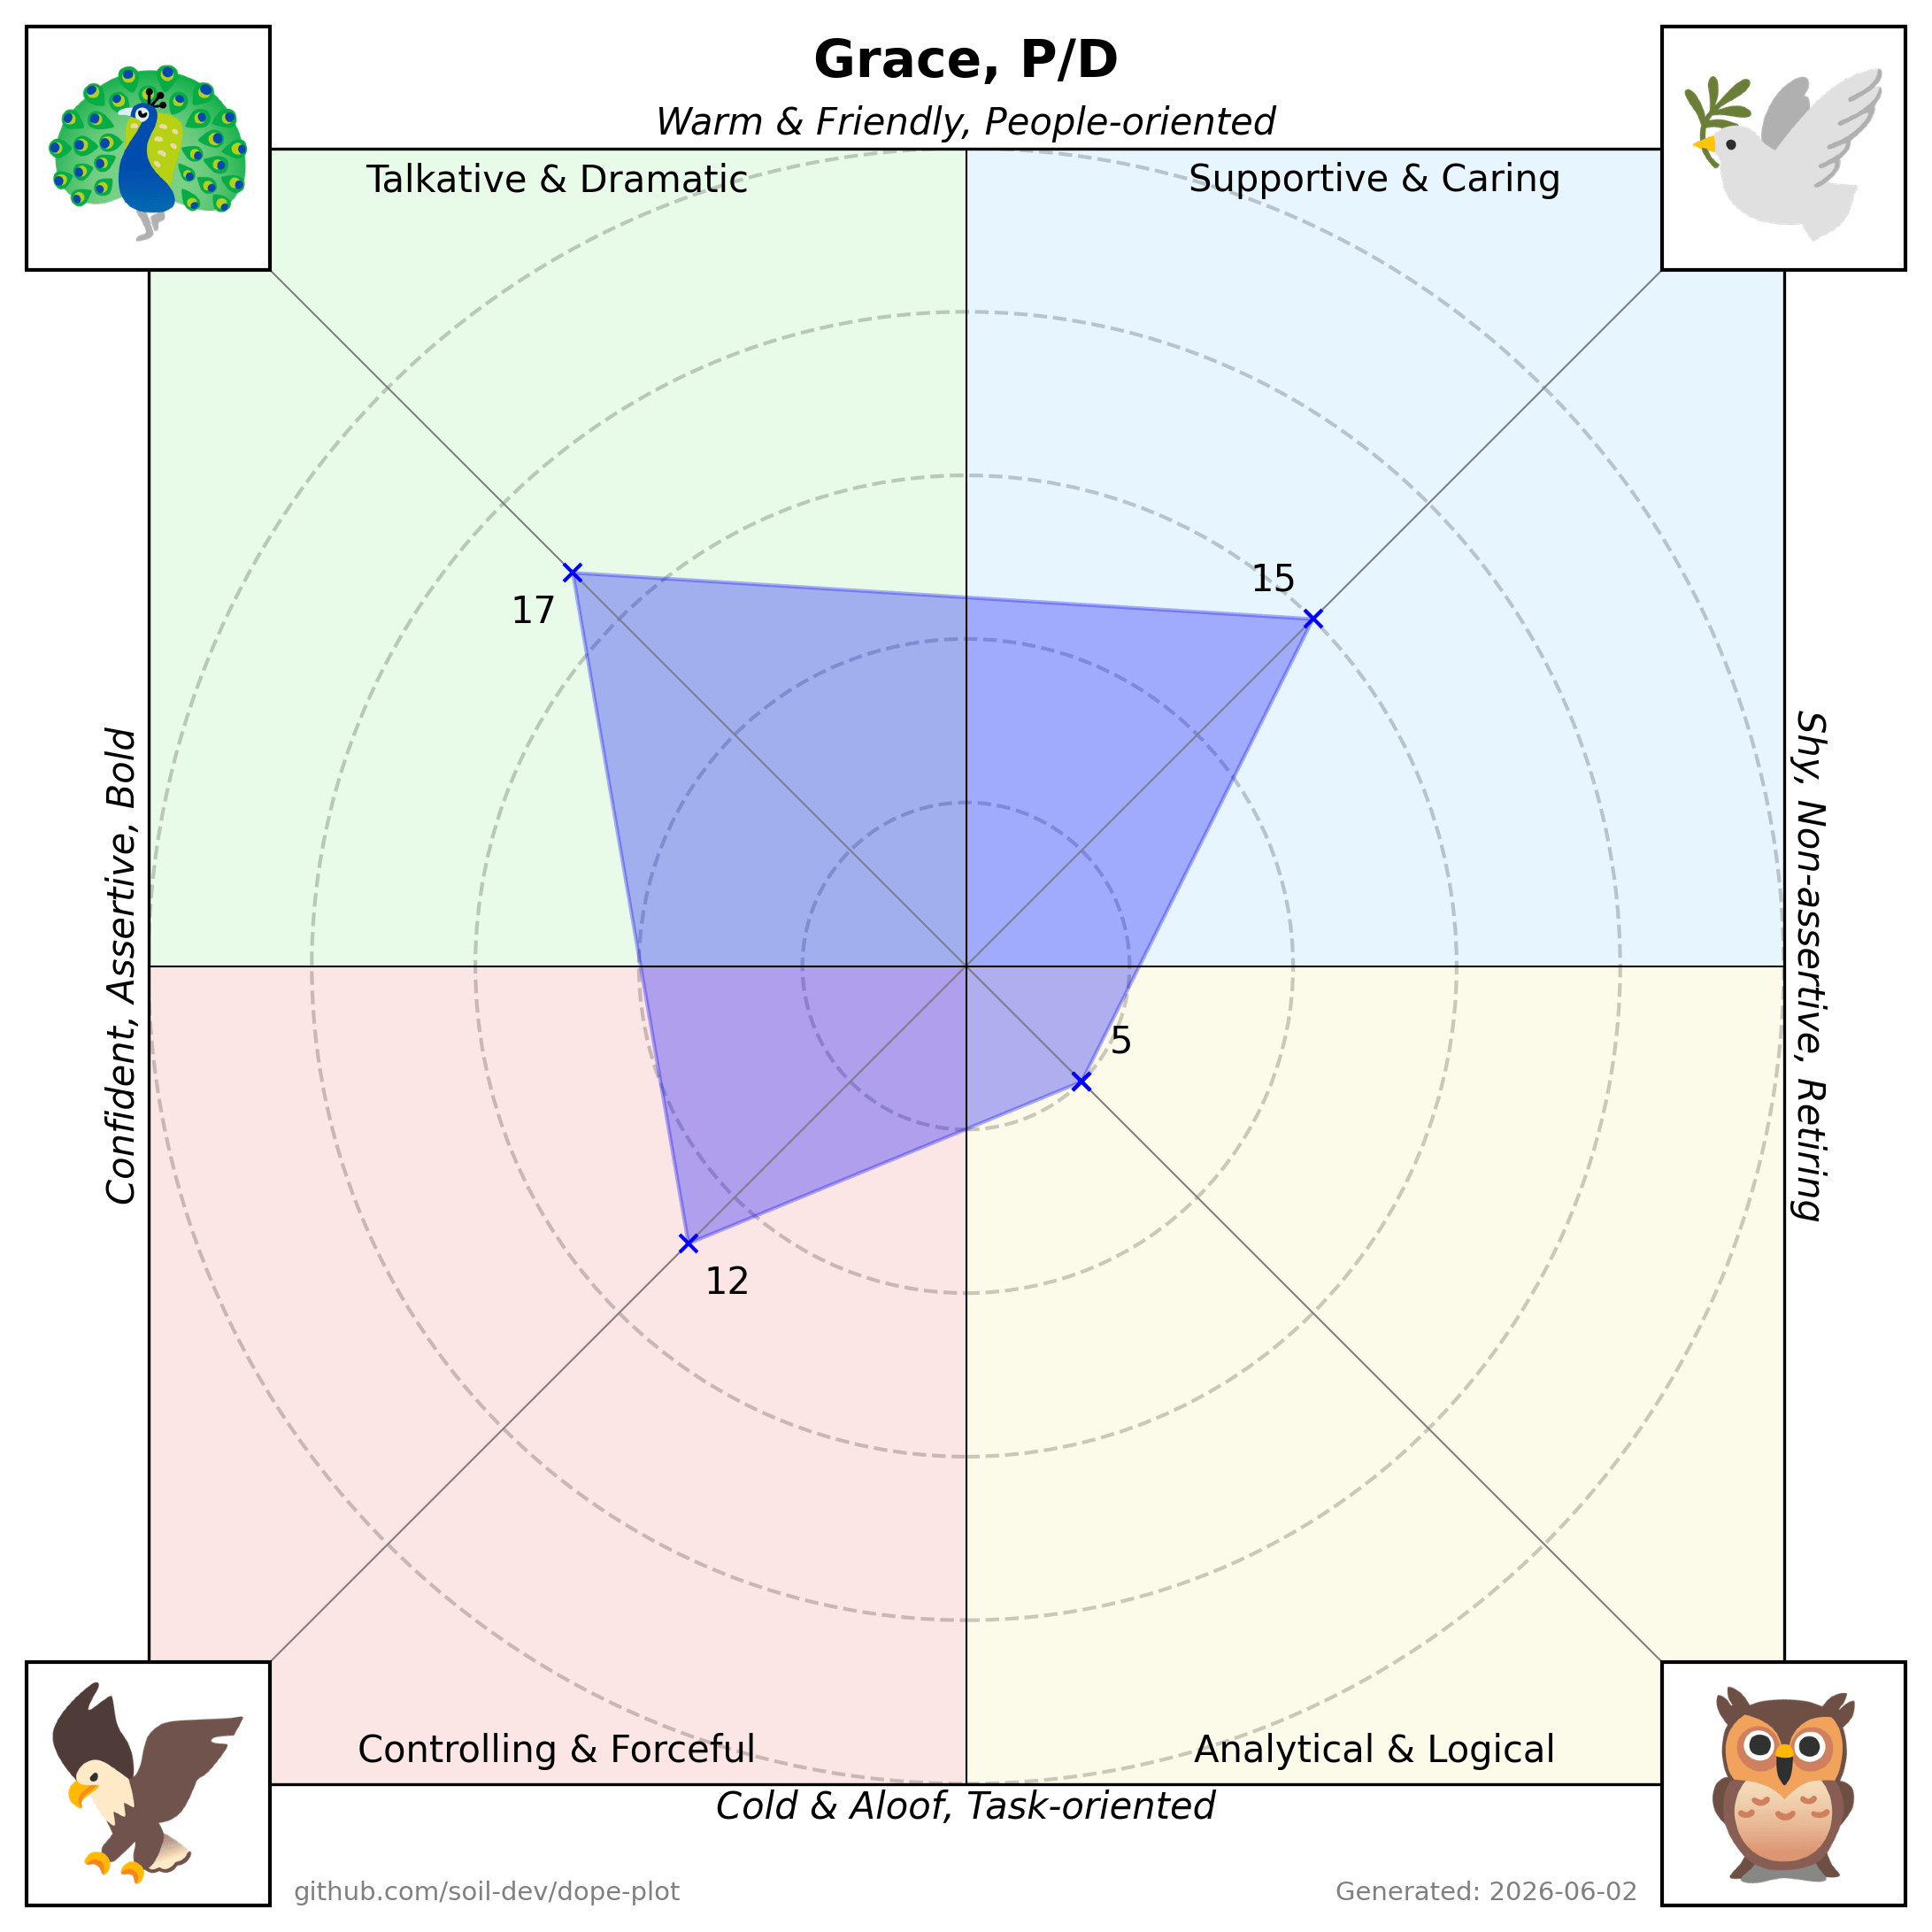
Radar Plot for individuals:
- Shows how a single person’s personality scores map onto the four quadrants.
- A polygon connecting each dimension’s score.
-
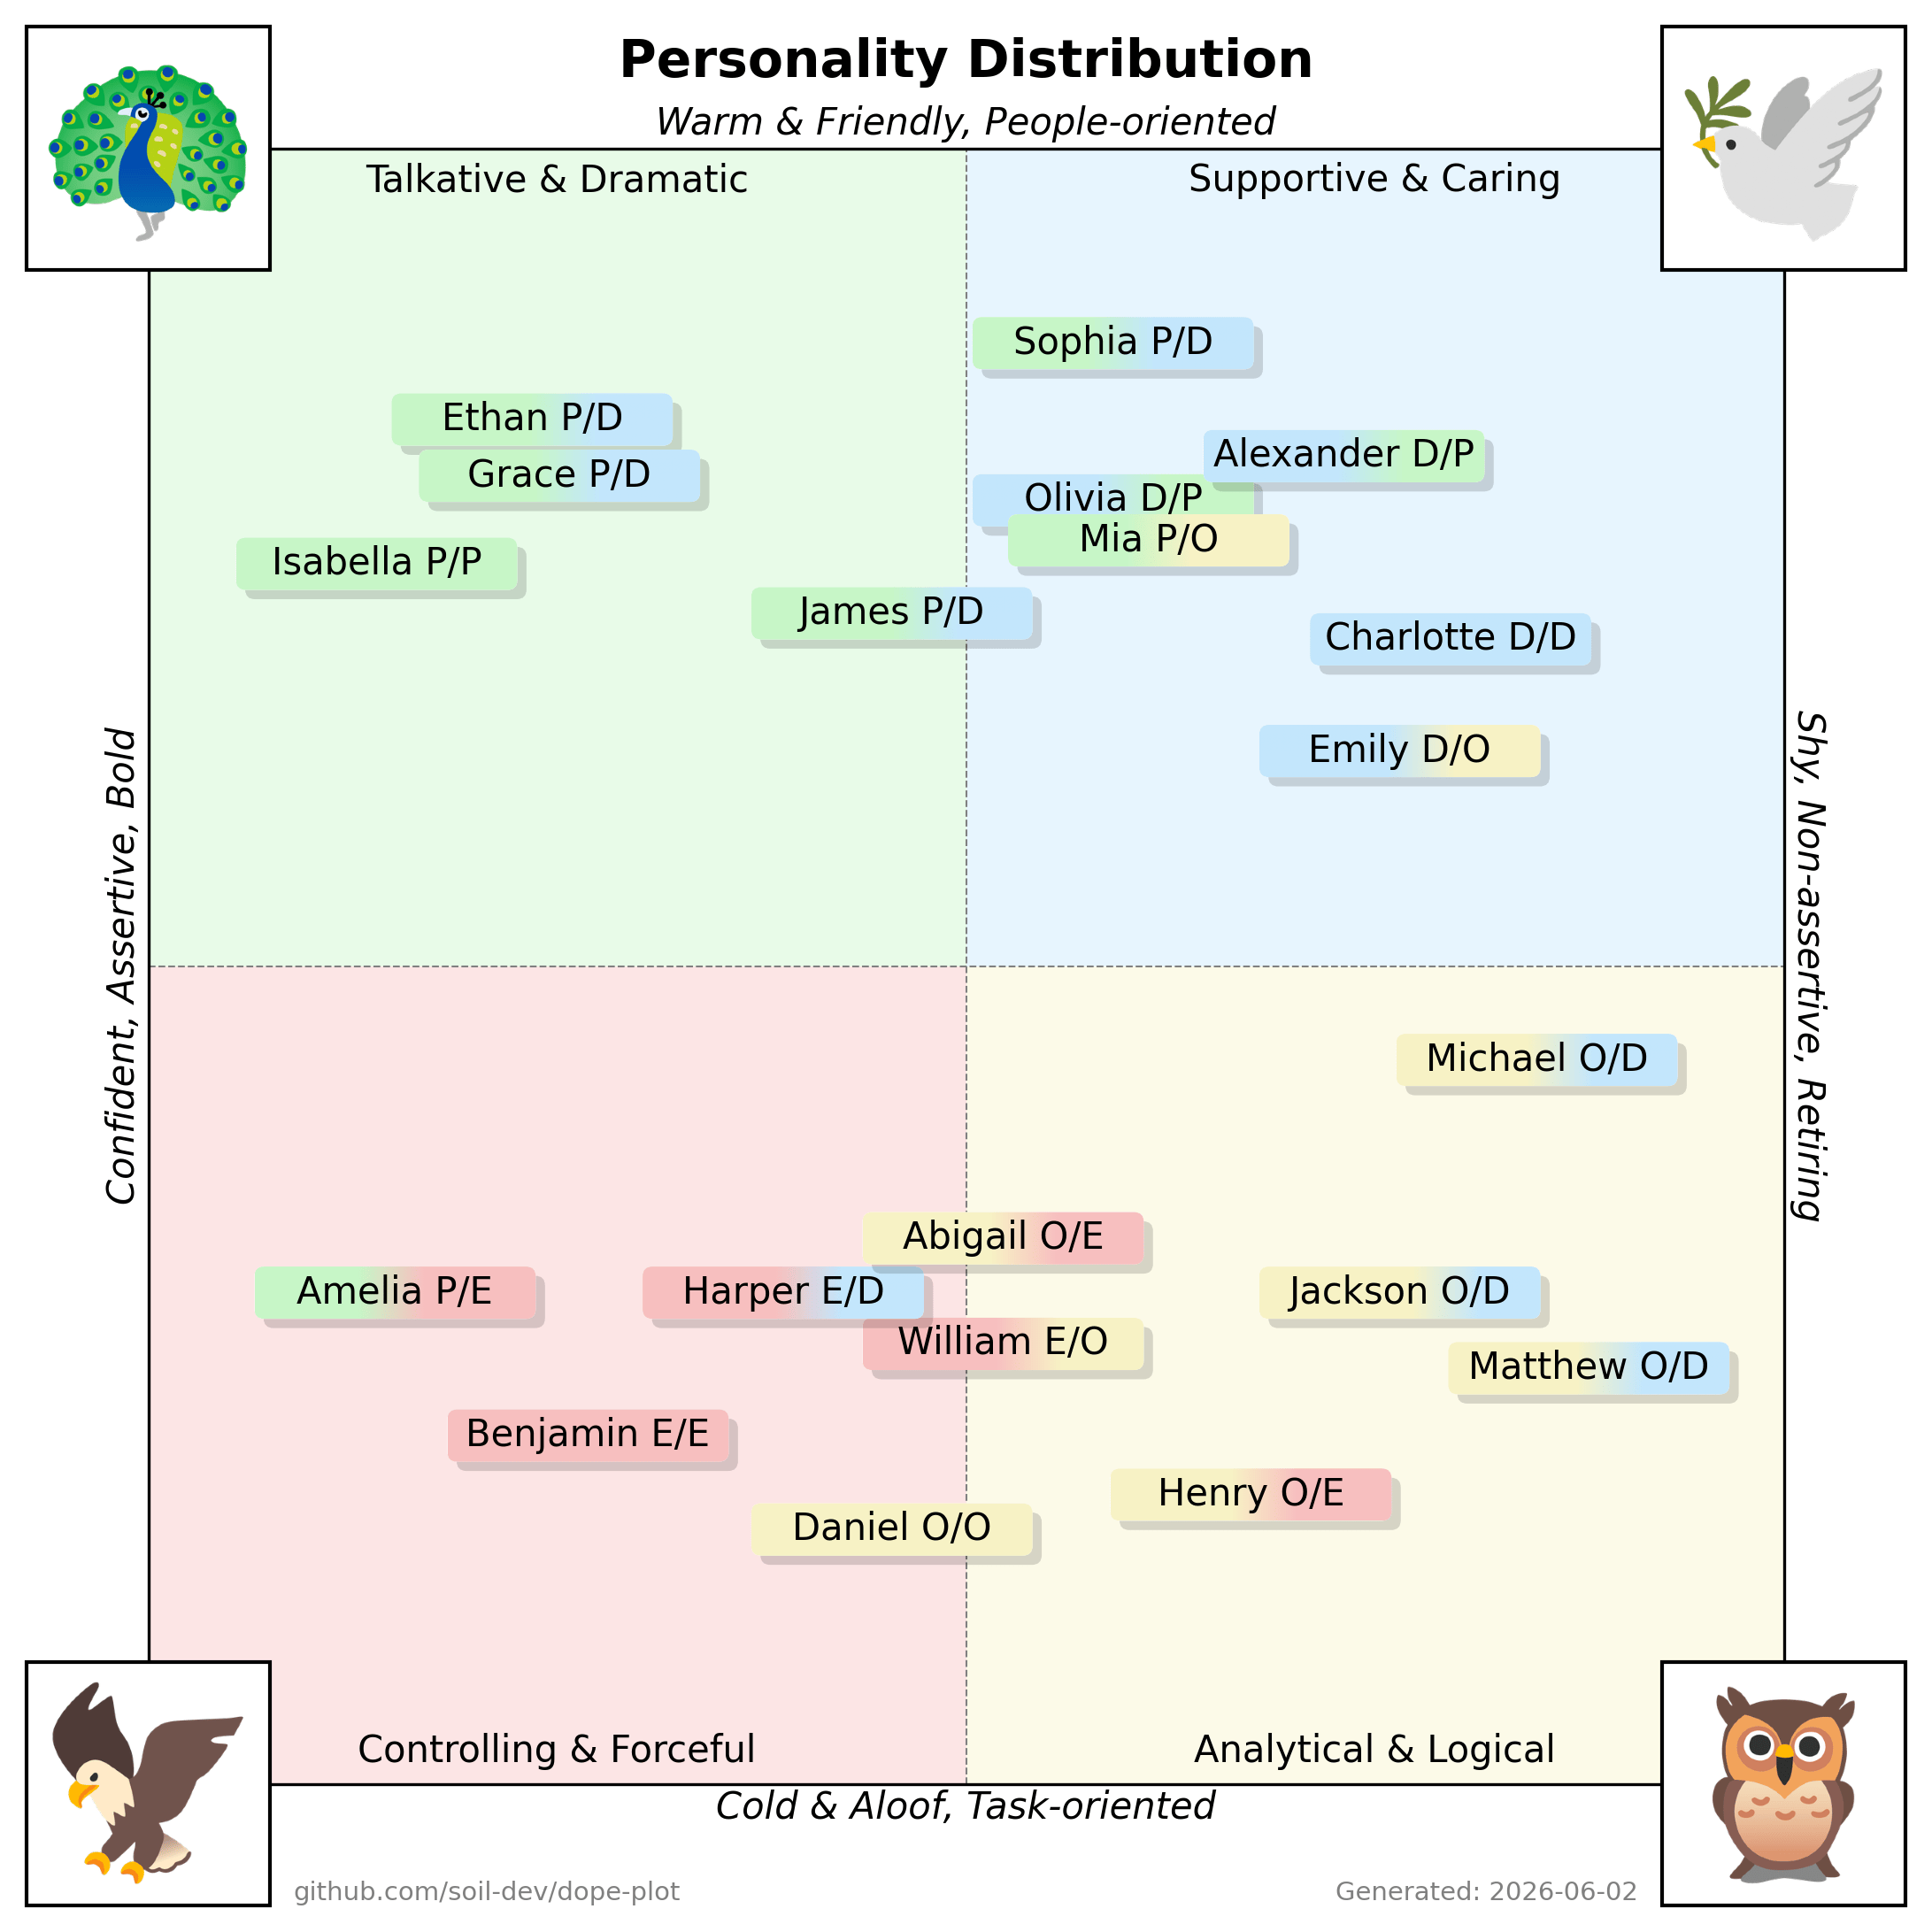
Team/Group Distribution:
- Plots multiple people on a quadrant-based chart, illustrating the distribution of personalities in a single view.
- Useful for quickly identifying group strengths, diversity, and potential gaps.
-
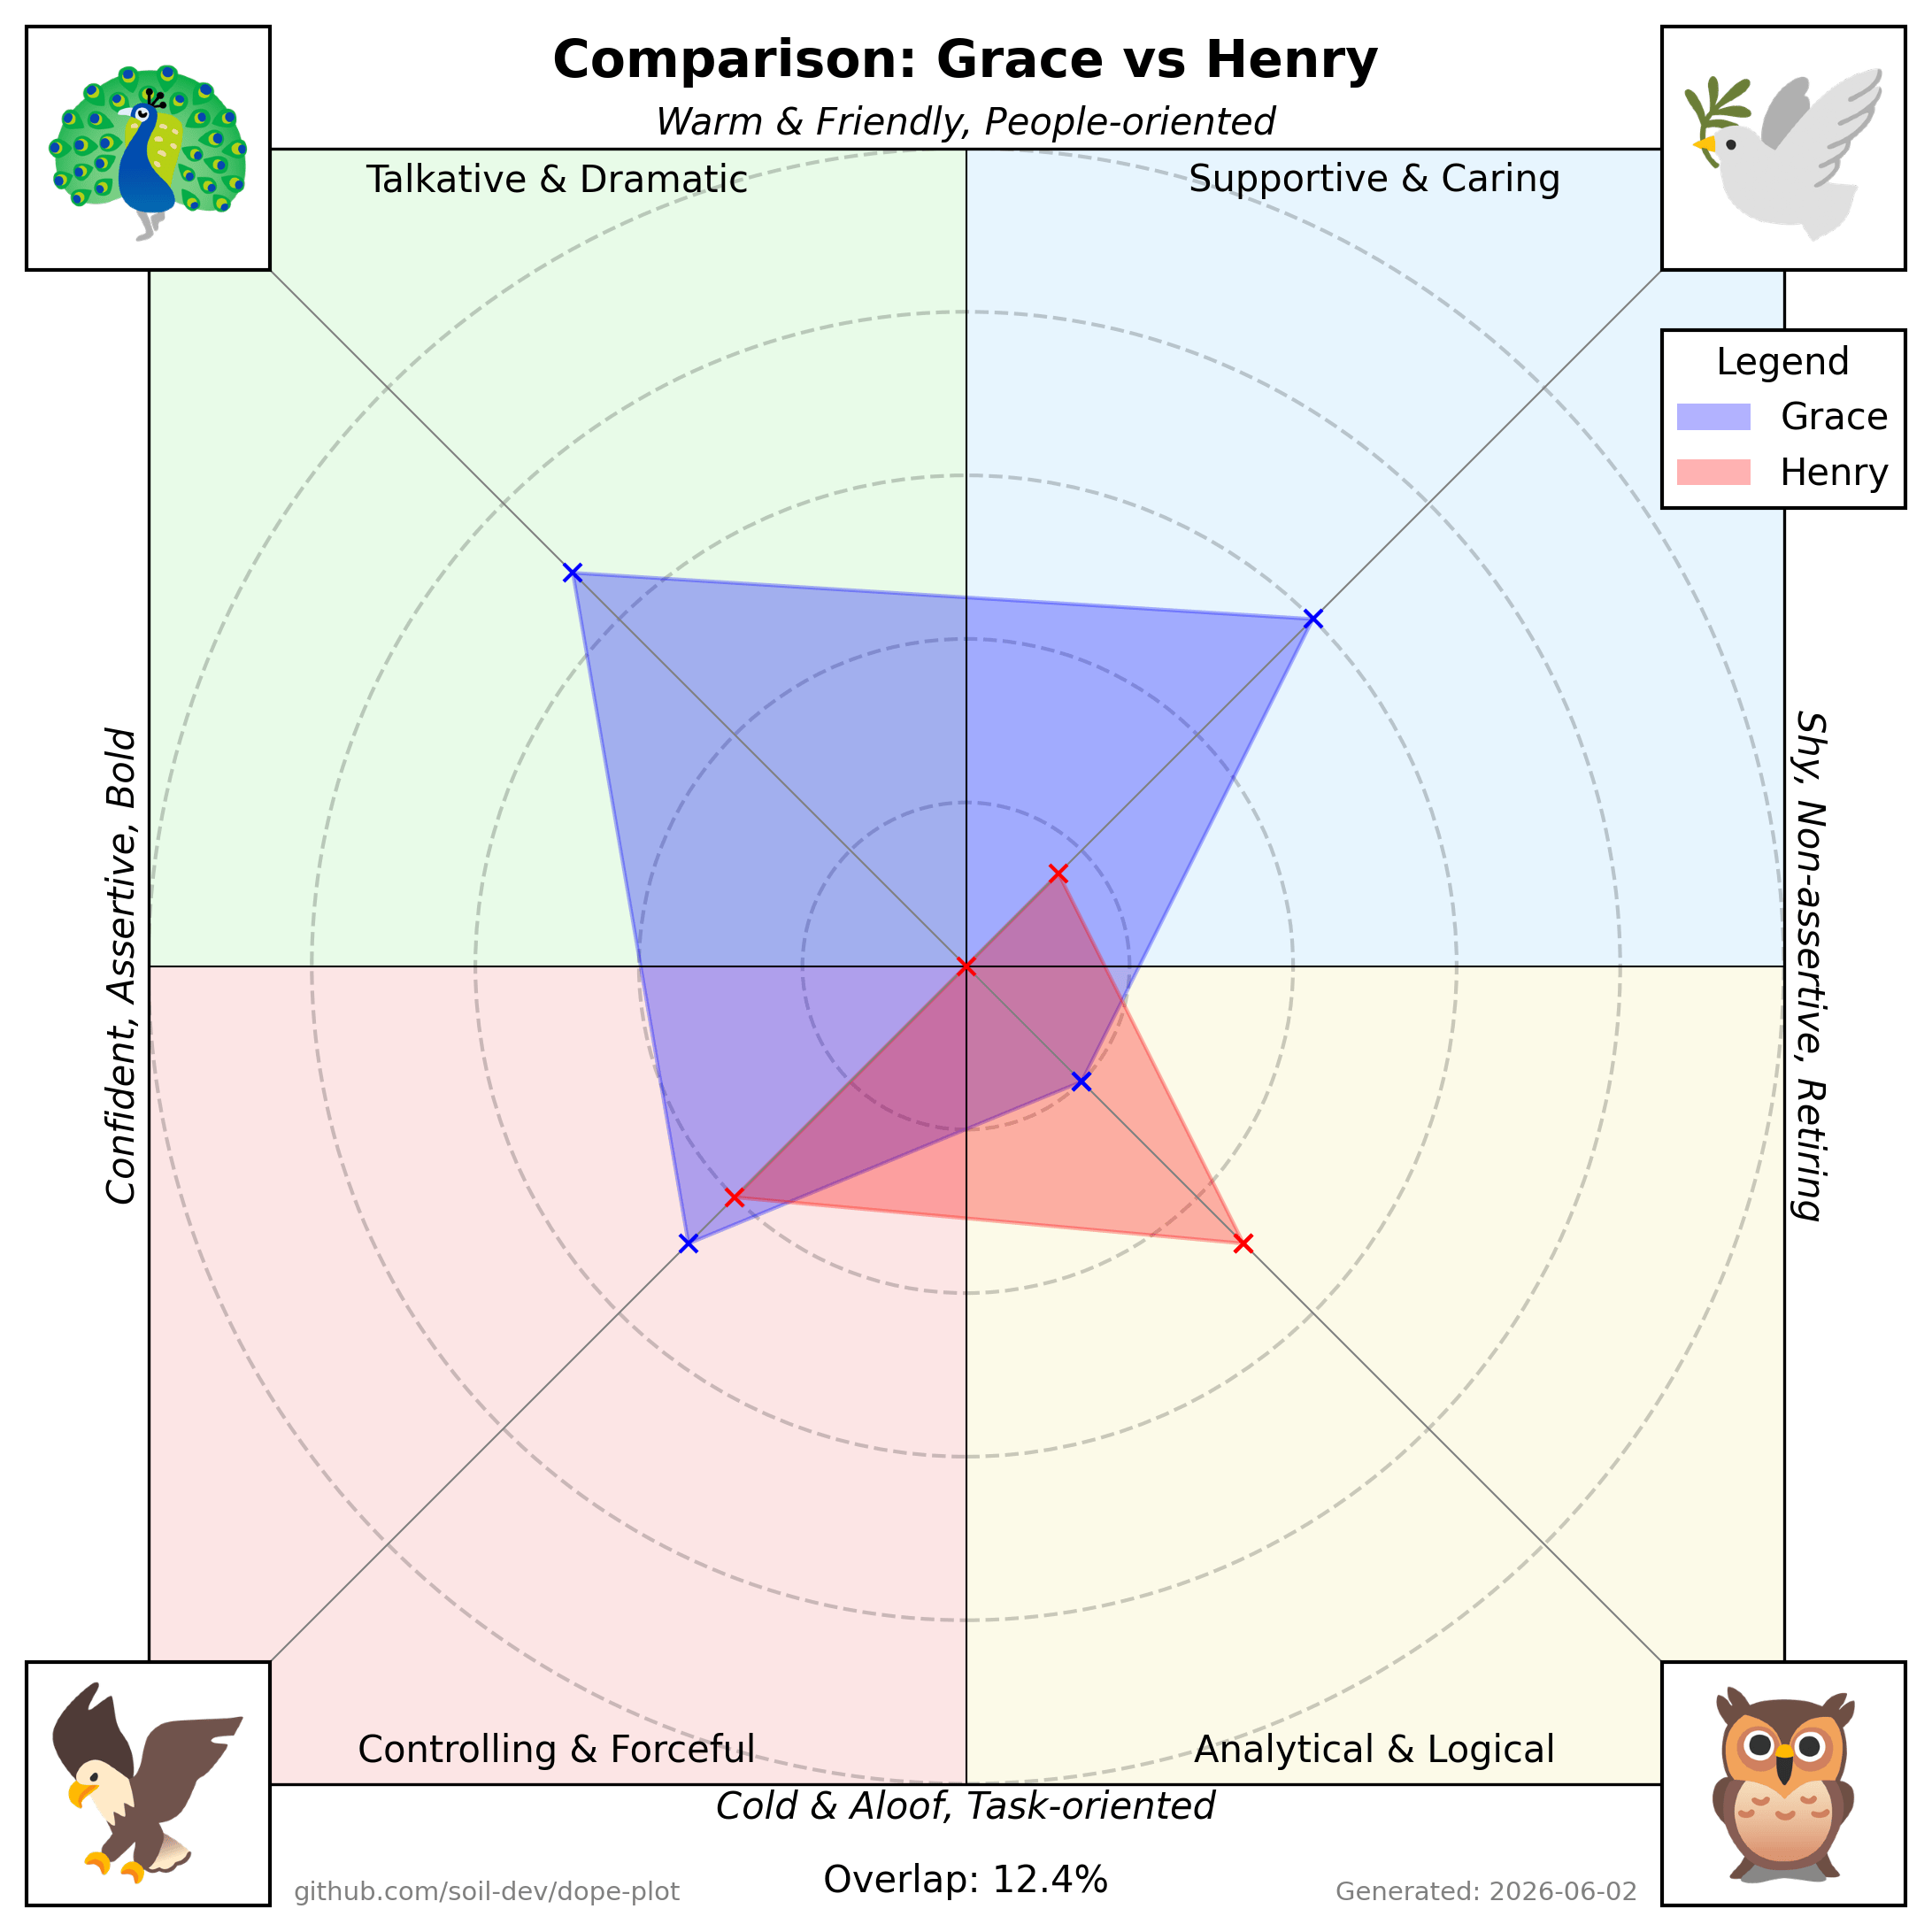
Pairwise Comparison:
- Overlays two individuals’ radar polygons on the same chart to highlight similarities and differences.
- Displays a percentage overlap for a quick gauge of alignment.
- Clone or Download the Repository
git clone https://github.com/soil-dev/dope-plot.git
cd dope-plot- Install Dependencies with Poetry
This project uses Poetry for dependency management.
poetry install- (Optional) Activate the Virtual Environment
poetry env activate(On Poetry 2.x poetry shell moved to a plugin; poetry env activate prints the
activation command.) Or you can use poetry run ... without activating the shell.
- Verify Installation
poetry run dope-plot --helpThis should display a help message with usage instructions.
-
Prepare Your Data Ensure you have a CSV or similar data file that includes each person’s scores. (See Input Data Format below.)
-
Run Dope-Plot
poetry run dope-plot --data data.csv --graph radar scatter- --data Path to the CSV data file (default: data.csv)
- --graph Type of graph to generate (radar or scatter)
- --config Optional path to a TOML config file. If omitted, Dope-Plot uses
./config.tomlwhen present, otherwise its bundled defaults.
- Check Generated Plots
The script will create .png files in the charts folder.
Note: Run poetry run dope-plot --help for detailed usage.
| Name | Dove | Eagle | Owl | Peacock | Note |
|---|---|---|---|---|---|
| Grace | 15 | 12 | 5 | 17 | P/D |
| Henry | 4 | 10 | 12 | 0 | O/E |
| ... | ... | ... | ... | ... | ... |
- Name: The individual’s name or identifier.
- Dove, Eagle, Owl, Peacock: Numeric scores representing each “bird” trait.
- Note: Individual's primary and secondary dominant "bird" traits, separated by a forward slash.
Dope-Plot ships a Model Context Protocol server so AI assistants can generate charts directly, getting the rendered PNG back inline. It works with any MCP-capable client (Claude Desktop/Code, n8n's MCP node, OpenAI agents, …).
Install with the optional mcp extra and run the server (it speaks MCP over
stdio):
pip install 'dope-plot[mcp]'
dope-plot-mcp
Then register it in your client. For example, Claude Desktop
(claude_desktop_config.json) or Claude Code (.mcp.json):
{
  "mcpServers": {
    "dope-plot": { "command": "dope-plot-mcp" }
  }
}
Tools exposed (each returns a PNG):
scatter_chart(csv)— the group quadrant plot from CSV text (Name,Dove,Eagle,Owl,Peacock[,Note]).radar_chart(name, dove, eagle, owl, peacock, note="")— one person's radar.comparison_chart(...two people's scores...)— overlay two radars with an overlap percentage.
No config.toml is required — the server uses the bundled defaults and assets.
Run the test suite with:
poetry run pytest- Individual Radar Plot
- Plots one person’s scores around four axes (Eagle, Dove, Owl, Peacock).
- The polygon edges connect each axis’s numeric value, visually representing personality strengths.
- Group/Team Distribution - Scatter Plot
- Displays multiple names on a quadrant chart.
- Each quadrant corresponds to a “bird” style, with positions indicating how strongly each person aligns to one or more dimensions.
- Comparison/Overlap Plot
- Overlays two radar plots for a side-by-side comparison.
- Shows an “Overlap” percentage as a measure of similarity.
(Note: The above images are illustrative examples.)
The scatter plot scales each cohort to fill the quadrants so that name boxes spread out instead of colliding. This is a deliberate trade-off (positions are relative to the loaded group, not absolute). See docs/DESIGN.md for the rationale and before/after examples.
This project is licensed under the Apache 2.0 License. You are free to use, modify, and distribute this software in accordance with the license terms.